Tables and Figures

Welcome to the Purdue OWL
This page is brought to you by the OWL at Purdue University. When printing this page, you must include the entire legal notice.
Copyright ©1995-2018 by The Writing Lab & The OWL at Purdue and Purdue University. All rights reserved. This material may not be published, reproduced, broadcast, rewritten, or redistributed without permission. Use of this site constitutes acceptance of our terms and conditions of fair use.
The purpose of tables and figures in documents is to enhance your readers' understanding of the information in the document; usually, large amounts of information can be communicated more efficiently in tables or figures. Tables are any graphic that uses a row and column structure to organize information, whereas figures include any illustration or image other than a table.
General guidelines
Necessity
Visual material such as tables and figures can be used quickly and efficiently to present a large amount of information to an audience, but visuals must be used to assist communication, not to use up space, or disguise marginally significant results behind a screen of complicated statistics. Ask yourself this question first: Is the table or figure necessary? For example, it is better to present simple descriptive statistics in the text, not in a table.
Relation of Tables or Figures and Text
Because tables and figures supplement the text, refer in the text to all tables and figures used and explain what the reader should look for when using the table or figure. Focus only on the important point the reader should draw from them, and leave the details for the reader to examine on their own.
Documentation
If you are using figures, tables and/or data from other sources, be sure to gather all the information you will need to properly document your sources.
Integrity and Independence
Each table and figure must be intelligible without reference to the text, so be sure to include an explanation of every abbreviation (except the standard statistical symbols and abbreviations).
Organization, Consistency, and Coherence
Number all tables sequentially as you refer to them in the text (Table 1, Table 2, etc.), likewise for figures (Figure 1, Figure 2, etc.). Abbreviations, terminology, and probability level values must be consistent across tables and figures in the same article. Likewise, formats, titles, and headings must be consistent. Do not repeat the same data in different tables.
Tables
Data in a table that would require only two or fewer columns and rows should be presented in the text. More complex data is better presented in tabular format. In order for quantitative data to be presented clearly and efficiently, it must be arranged logically, e.g. data to be compared must be presented next to one another (before/after, young/old, male/female, etc.), and statistical information (means, standard deviations, N values) must be presented in separate parts of the table. If possible, use canonical forms (such as ANOVA, regression, or correlation) to communicate your data effectively.
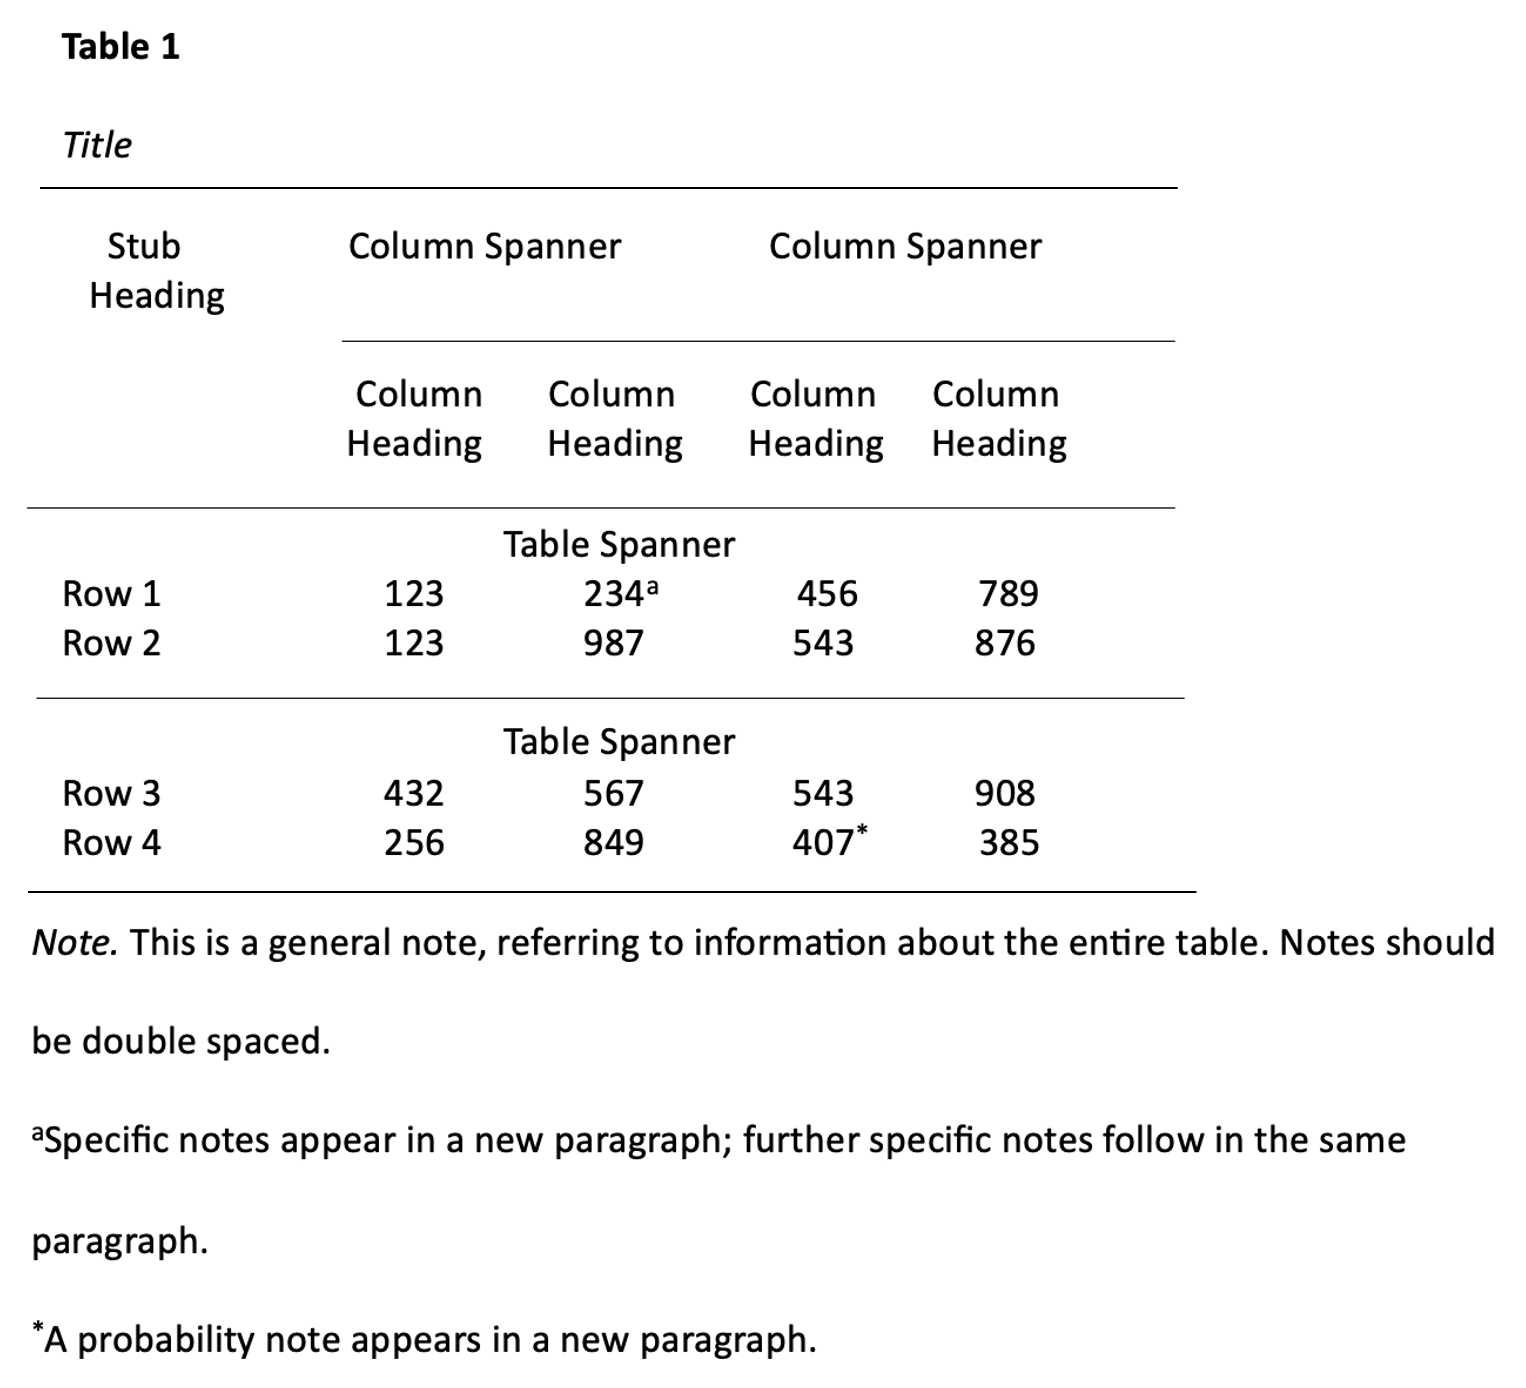
A generic example of a table with multiple notes formatted in APA 7 style.
Elements of Tables
Numbers
Number all tables with Arabic numerals sequentially. Do not use suffix letters (e.g. Table 3a, 3b, 3c); instead, combine the related tables. If the manuscript includes an appendix with tables, identify them with capital letters and Arabic numerals (e.g. Table A1, Table B2).
Titles
Like the title of the paper itself, each table must have a clear and concise title. Titles should be written in italicized title case below the table number, with a blank line between the number and the title. When appropriate, you may use the title to explain an abbreviation parenthetically.
Comparison of Median Income of Adopted Children (AC) v. Foster Children (FC)
Headings
Keep headings clear and brief. The heading should not be much wider than the widest entry in the column. Use of standard abbreviations can aid in achieving that goal. There are several types of headings:
- Stub headings describe the lefthand column, or stub column, which usually lists major independent variables.
- Column headings describe entries below them, applying to just one column.
- Column spanners are headings that describe entries below them, applying to two or more columns which each have their own column heading. Column spanners are often stacked on top of column headings and together are called decked heads.
- Table Spanners cover the entire width of the table, allowing for more divisions or combining tables with identical column headings. They are the only type of heading that may be plural.
All columns must have headings, written in sentence case and using singular language (Item rather than Items) unless referring to a group (Men, Women). Each column’s items should be parallel (i.e., every item in a column labeled “%” should be a percentage and does not require the % symbol, since it’s already indicated in the heading). Subsections within the stub column can be shown by indenting headings rather than creating new columns:
Chemical Bonds
Ionic
Covalent
Metallic
Body
The body is the main part of the table, which includes all the reported information organized in cells (intersections of rows and columns). Entries should be center aligned unless left aligning them would make them easier to read (longer entries, usually). Word entries in the body should use sentence case. Leave cells blank if the element is not applicable or if data were not obtained; use a dash in cells and a general note if it is necessary to explain why cells are blank. In reporting the data, consistency is key: Numerals should be expressed to a consistent number of decimal places that is determined by the precision of measurement. Never change the unit of measurement or the number of decimal places in the same column.
Notes
There are three types of notes for tables: general, specific, and probability notes. All of them must be placed below the table in that order.
General notes explain, qualify or provide information about the table as a whole. Put explanations of abbreviations, symbols, etc. here.
Example: Note. The racial categories used by the US Census (African-American, Asian American, Latinos/-as, Native-American, and Pacific Islander) have been collapsed into the category “non-White.” E = excludes respondents who self-identified as “White” and at least one other “non-White” race.
Specific notes explain, qualify or provide information about a particular column, row, or individual entry. To indicate specific notes, use superscript lowercase letters (e.g. a, b, c), and order the superscripts from left to right, top to bottom. Each table’s first footnote must be the superscript a.
a n = 823. b One participant in this group was diagnosed with schizophrenia during the survey.
Probability notes provide the reader with the results of the tests for statistical significance. Asterisks indicate the values for which the null hypothesis is rejected, with the probability (p value) specified in the probability note. Such notes are required only when relevant to the data in the table. Consistently use the same number of asterisks for a given alpha level throughout your paper.
*p < .05. **p < .01. ***p < .001
If you need to distinguish between two-tailed and one-tailed tests in the same table, use asterisks for two-tailed p values and an alternate symbol (such as daggers) for one-tailed p values.
*p < .05, two-tailed. **p < .01, two-tailed. †p <.05, one-tailed. ††p < .01, one-tailed.
Borders
Tables should only include borders and lines that are needed for clarity (i.e., between elements of a decked head, above column spanners, separating total rows, etc.). Do not use vertical borders, and do not use borders around each cell. Spacing and strict alignment is typically enough to clarify relationships between elements.
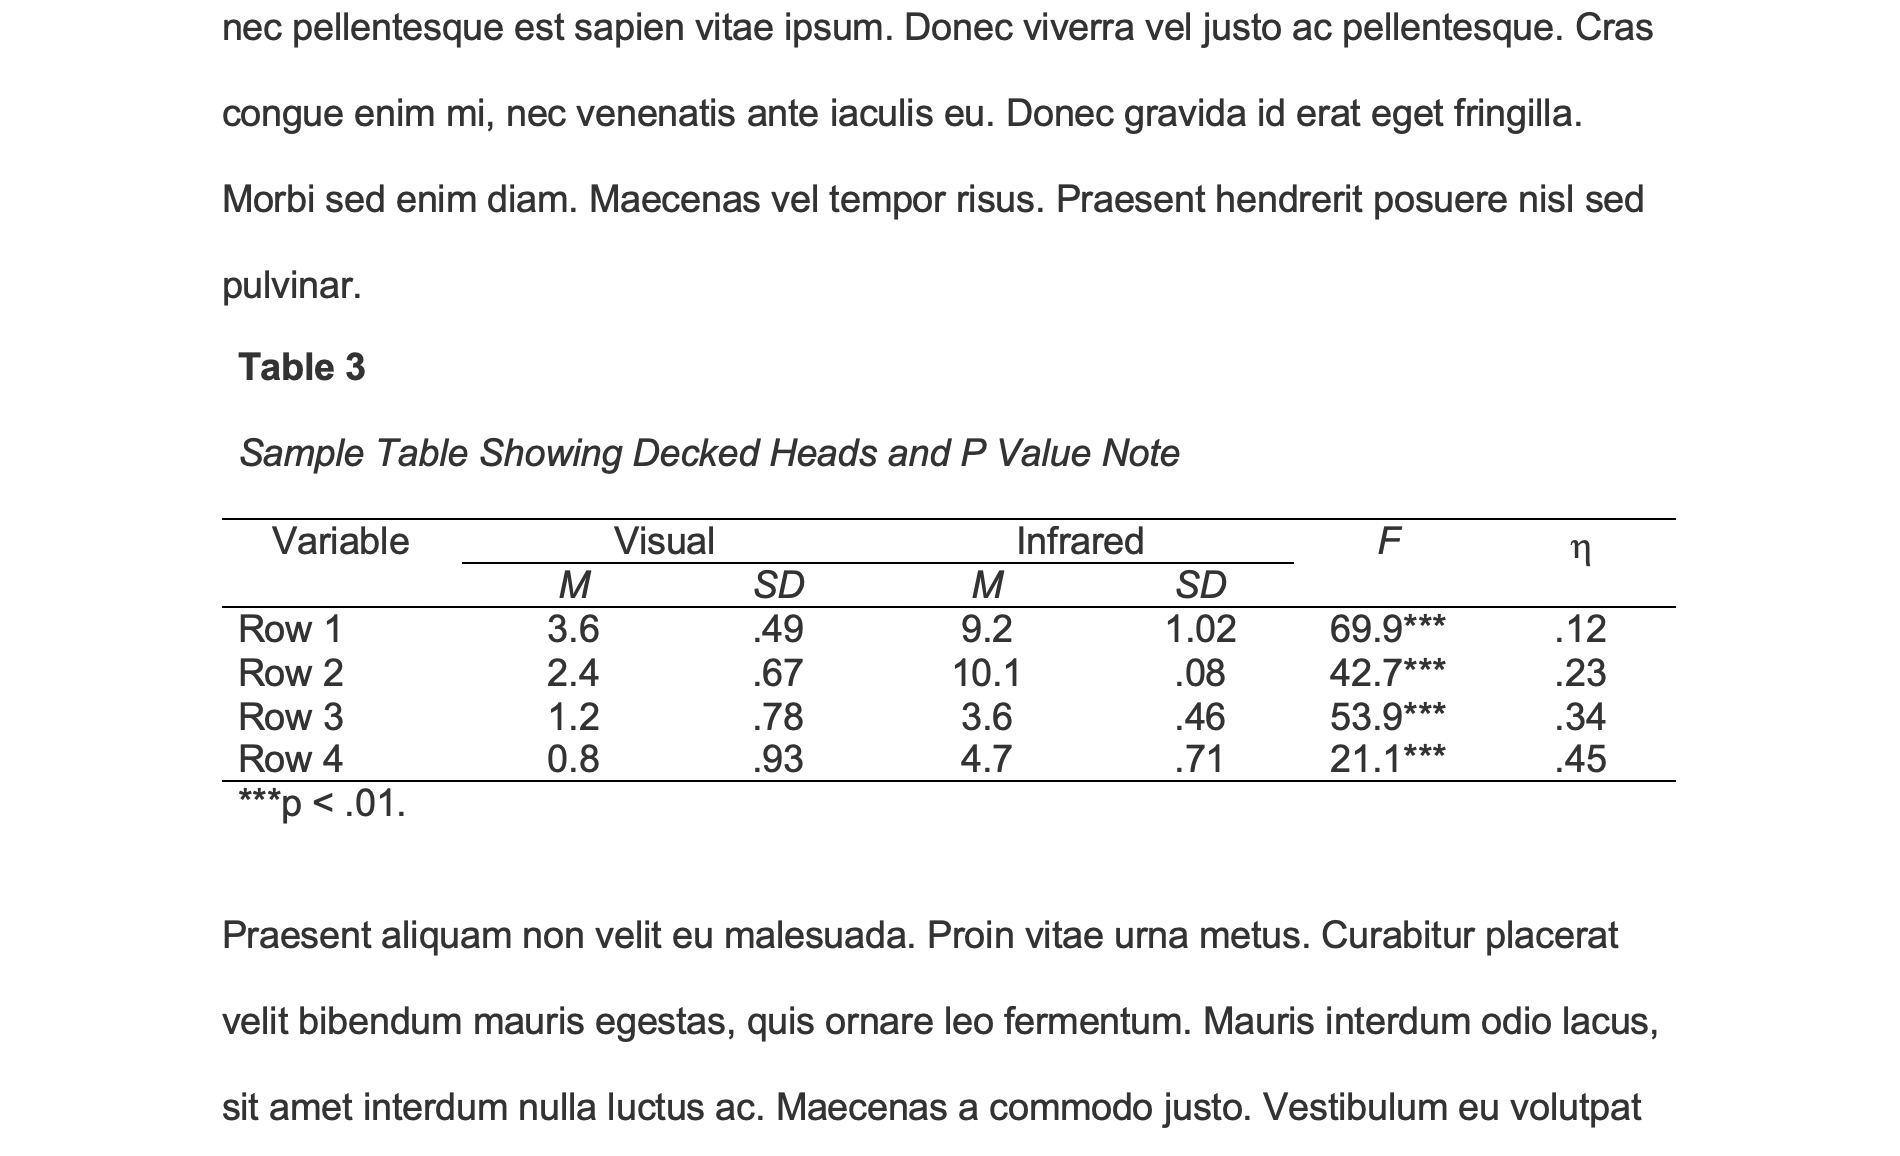
Example of a table in the text of an APA 7 paper. Note the lack of vertical borders.
Tables from Other Sources
If using tables from an external source, copy the structure of the original exactly, and cite the source in accordance with APA style.
Table Checklist
(Taken from the Publication Manual of the American Psychological Association, 7th ed., Section 7.20)
- Is the table necessary?
- Does it belong in the print and electronic versions of the article, or can it go in an online supplemental file?
- Are all comparable tables presented consistently?
- Are all tables numbered with Arabic numerals in the order they are mentioned in the text? Is the table number bold and left-aligned?
- Are all tables referred to in the text?
- Is the title brief but explanatory? Is it presented in italicized title case and left-aligned?
- Does every column have a column heading? Are column headings centered?
- Are all abbreviations; special use of italics, parentheses, and dashes; and special symbols explained?
- Are the notes organized according to the convention of general, specific, probability?
- Are table borders correctly used (top and bottom of table, beneath column headings, above table spanners)?
- Does the table use correct line spacing (double for the table number, title, and notes; single, one and a half, or double for the body)?
- Are entries in the left column left-aligned beneath the centered stub heading? Are all other column headings and cell entries centered?
- Are confidence intervals reported for all major point estimates?
- Are all probability level values correctly identified, and are asterisks attached to the appropriate table entries? Is a probability level assigned the same number of asterisks in all the tables in the same document?
- If the table or its data are from another source, is the source properly cited? Is permission necessary to reproduce the table?
Figures
Figures include all graphical displays of information that are not tables. Common types include graphs, charts, drawings, maps, plots, and photos. Just like tables, figures should supplement the text and should be both understandable on their own and referenced fully in the text. This section details elements of formatting writers must use when including a figure in an APA document, gives an example of a figure formatted in APA style, and includes a checklist for formatting figures.
Preparing Figures
In preparing figures, communication and readability must be the ultimate criteria. Avoid the temptation to use the special effects available in most advanced software packages. While three-dimensional effects, shading, and layered text may look interesting to the author, overuse, inconsistent use, and misuse may distort the data, and distract or even annoy readers. Design properly done is inconspicuous, almost invisible, because it supports communication. Design improperly, or amateurishly, done draws the reader’s attention from the data, and makes him or her question the author’s credibility. Line drawings are usually a good option for readability and simplicity; for photographs, high contrast between background and focal point is important, as well as cropping out extraneous detail to help the reader focus on the important aspects of the photo.
Parts of a Figure
Numbers
All figures that are part of the main text require a number using Arabic numerals (Figure 1, Figure 2, etc.). Numbers are assigned based on the order in which figures appear in the text and are bolded and left aligned.
Title
Under the number, write the title of the figure in italicized title case. The title should be brief, clear, and explanatory, and both the title and number should be double spaced.
Image
The image of the figure is the body, and it is positioned underneath the number and title. The image should be legible in both size and resolution; fonts should be sans serif, consistently sized, and between 8-14 pt. Title case should be used for axis labels and other headings; descriptions within figures should be in sentence case. Shading and color should be limited for clarity; use patterns along with color and check contrast between colors with free online checkers to ensure all users (people with color vision deficiencies or readers printing in grayscale, for instance) can access the content. Gridlines and 3-D effects should be avoided unless they are necessary for clarity or essential content information.
Legends
Legends, or keys, explain symbols, styles, patterns, shading, or colors in the image. Words in the legend should be in title case; legends should go within or underneath the image rather than to the side. Not all figures will require a legend.
Notes
Notes clarify the content of the figure; like tables, notes can be general, specific, or probability. General notes explain units of measurement, symbols, and abbreviations, or provide citation information. Specific notes identify specific elements using superscripts; probability notes explain statistical significance of certain values.

A generic example of a figure formatted in APA 7 style.
Figure Checklist
(Taken from the Publication Manual of the American Psychological Association, 7th ed., Section 7.35)
- Is the figure necessary?
- Does the figure belong in the print and electronic versions of the article, or is it supplemental?
- Is the figure simple, clean, and free of extraneous detail?
- Is the figure title descriptive of the content of the figure? Is it written in italic title case and left aligned?
- Are all elements of the figure clearly labeled?
- Are the magnitude, scale, and direction of grid elements clearly labeled?
- Are parallel figures or equally important figures prepared according to the same scale?
- Are the figures numbered consecutively with Arabic numerals? Is the figure number bold and left aligned?
- Has the figure been formatted properly? Is the font sans serif in the image portion of the figure and between sizes 8 and 14?
- Are all abbreviations and special symbols explained?
- If the figure has a legend, does it appear within or below the image? Are the legend’s words written in title case?
- Are the figure notes in general, specific, and probability order? Are they double-spaced, left aligned, and in the same font as the paper?
- Are all figures mentioned in the text?
- Has written permission for print and electronic reuse been obtained? Is proper credit given in the figure caption?
- Have all substantive modifications to photographic images been disclosed?
- Are the figures being submitted in a file format acceptable to the publisher?
- Have the files been produced at a sufficiently high resolution to allow for accurate reproduction?