APA Tables and Figures 1

Welcome to the Purdue OWL
This page is brought to you by the OWL at Purdue University. When printing this page, you must include the entire legal notice.
Copyright ©1995-2018 by The Writing Lab & The OWL at Purdue and Purdue University. All rights reserved. This material may not be published, reproduced, broadcast, rewritten, or redistributed without permission. Use of this site constitutes acceptance of our terms and conditions of fair use.
Note: This page reflects APA 6, which is now out of date. It will remain online until 2021, but will not be updated. The equivalent APA 7 page can be found here.
The purpose of tables and figures in documents is to enhance your readers' understanding of the information in the document. Most word processing software available today will allow you to create your own tables and figures, and even the most basic of word processors permit the embedding of images, thus enabling you to include tables and figures in almost any document.
General guidelines
Necessity. Visual material such as tables and figures can be used quickly and efficiently to present a large amount of information to an audience, but visuals must be used to assist communication, not to use up space, or disguise marginally significant results behind a screen of complicated statistics. Ask yourself this question first: Is the table or figure necessary? For example, it is better to present simple descriptive statistics in the text, not in a table.
Relation of Tables or Figures and Text. Because tables and figures supplement the text, refer in the text to all tables and figures used and explain what the reader should look for when using the table or figure. Focus only on the important point the reader should draw from them, and leave the details for the reader to examine on their own.
Documentation. If you are using figures, tables and/or data from other sources, be sure to gather all the information you will need to properly document your sources.
Integrity and Independence. Each table and figure must be intelligible without reference to the text, so be sure to include an explanation of every abbreviation (except the standard statistical symbols and abbreviations).
Organization, Consistency, and Coherence. Number all tables sequentially as you refer to them in the text (Table 1, Table 2, etc.), likewise for figures (Figure 1, Figure 2, etc.). Abbreviations, terminology, and probability level values must be consistent across tables and figures in the same article. Likewise, formats, titles, and headings must be consistent. Do not repeat the same data in different tables.
Tables
(Taken from the Publication Manual of the American Psychological Association, 6th ed., Section 5.19)
- Is the table necessary?
- Does it belong in the print and electronic versions of the article, or can it go in an online supplemental file?
- Are all comparable tables presented consistently?
- Is the entire table single- or double-spaced (including the title, headings, and notes)?
- Is the title brief but explanatory?
- Does every column have a column heading?
- Are all abbreviations; special use of italics, parentheses, and dashes; and special symbols explained?
- Are the notes organized according to the convention of general, specific, probability?
- Are all vertical rules eliminated?
- Are confidence intervals reported for all major point estimates?
- Are all probability level values correctly identified, and are asterisks attached to the appropriate table entries? Is a probability level assigned the same number of asterisks in all the tables in the same document?
- If the table or its data are from another source, is the source properly cited?
- Is the table referred to in the text?
Tables
Data in a table that would require only two or fewer columns and rows should be presented in the text. More complex data is better presented in tabular format. In order for quantitative data to be presented clearly and efficiently, it must be arranged logically, e.g. data to be compared must be presented next to one another (before/after, young/old, male/female, etc.), and statistical information (means, standard deviations, N values) must be presented in separate parts of the table. If possible, use canonical forms (such as ANOVA, regression, or correlation) to communicate your data effectively.
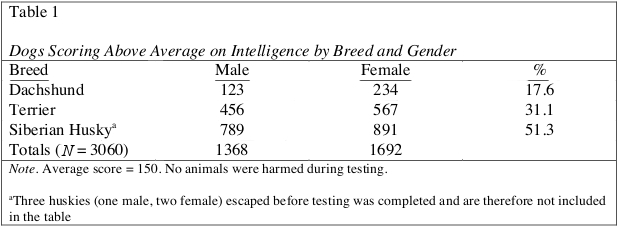
Table 1
Table Structure
The following image illustrates the basic structure of tables.
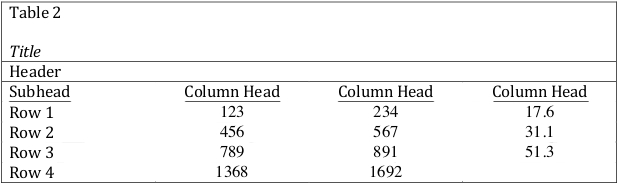
Table 2
Numbers. Number all tables with Arabic numerals sequentially. Do not use suffix letters (e.g. Table 3a, 3b, 3c); instead, combine the related tables. If the manuscript includes an appendix with tables, identify them with capital letters and Arabic numerals (e.g. Table A1, Table B2).
Titles. Like the title of the paper itself, each table must have a clear and concise title. When appropriate, you may use the title to explain an abbreviation parenthetically.
Example: Comparison of Median Income of Adopted Children (AC) v. Foster Children (FC)
Headings. Keep headings clear and brief. The heading should not be much wider than the widest entry in the column. Use of standard abbreviations can aid in achieving that goal. All columns must have headings, even the stub column (see example structure), which customarily lists the major independent variables.
Body. In reporting the data, consistency is key: Numerals should be expressed to a consistent number of decimal places that is determined by the precision of measurement. Never change the unit of measurement or the number of decimal places in the same column.
Specific Types of Tables
Analysis of Variance (ANOVA) Tables. The conventional format for an ANOVA table is to list the source in the stub column, then the degrees of freedom (df) and the F ratios. Give the between-subject variables and error first, then within-subject and any error. Mean square errors must be enclosed in parentheses. Provide a general note to the table to explain what those values mean (see example). Use asterisks to identify statistically significant F ratios, and provide a probability footnote.
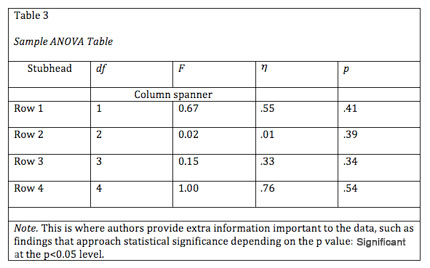
Table 3
Regression. Conventional reporting of regression analysis follows two formats. If the study is purely applied, list only the raw or unstandardized coefficients (B). If the study is purely theoretical, list only the standardized coefficients (beta). If the study was neither purely applied nor theoretical, then list both standardized and unstandardized coefficients. Specify the type of analysis, either hierarchical or simultaneous, and provide the increments of change if you used hierarchical regression.
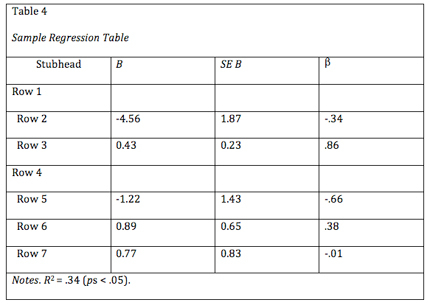
Table 4
Notes in Tables
There are three types of notes for tables: general, specific, and probability notes. All of them must be placed below the table in that order.
General notes explain, qualify or provide information about the table as a whole. Put explanations of abbreviations, symbols, etc. here.
Example: Note. The racial categories used by the US Census (African-American, Asian American, Latinos/-as, Native-American, and Pacific Islander) have been collapsed into the category “non-White.” E = excludes respondents who self-identified as “White” and at least one other “non-White” race.
Specific notes explain, qualify or provide information about a particular column, row, or individual entry. To indicate specific notes, use superscript lowercase letters (e.g. a, b, c), and order the superscripts from left to right, top to bottom. Each table’s first footnote must be the superscript a.
Example: a n = 823. b One participant in this group was diagnosed with schizophrenia during the survey.
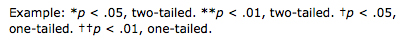
Probability notes provide the reader with the results of the tests for statistical significance. Asterisks indicate the values for which the null hypothesis is rejected, with the probability (p value) specified in the probability note. Such notes are required only when relevant to the data in the table. Consistently use the same number of asterisks for a given alpha level throughout your paper.
Sample Table Notes
If you need to distinguish between two-tailed and one-tailed tests in the same table, use asterisks for two-tailed p values and an alternate symbol (such as daggers) for one-tailed p values.
More Table Notes
Tables from Other Sources
If using tables from a source, copy the structure of the original exactly, and cite the source in accordance with APA style.