Tables, Figures, and Equations

Welcome to the Purdue OWL
This page is brought to you by the OWL at Purdue University. When printing this page, you must include the entire legal notice.
Copyright ©1995-2018 by The Writing Lab & The OWL at Purdue and Purdue University. All rights reserved. This material may not be published, reproduced, broadcast, rewritten, or redistributed without permission. Use of this site constitutes acceptance of our terms and conditions of fair use.
Tables, figures, and equations are the three categories of extra-textual items that require numbering and labelling. Each should be numbered consecutively throughout the paper – i.e., the numbering system does not start over in a new section or in an appendix, but simply continues on. For instance, if you have four figures in Section I, the first figure in Section II is simply Fig. 5, not Fig. II-1 or similar. The numbering of figures does not impact the numbering of tables or equations, but each category is numbered independently – e.g., if you have three figures and then a table, that table is still Table I, not Table IV.
Please note that tables, figures, and equations should always be introduced within the body of the paper before you show the actual table / figure / equation. If the data, or the figure itself, comes from an outside source, you should cite that source when you introduce the table / figure / equation. Moreover, you should follow the table / figure / equation with some form of explanation or connection to the broader point of your paper. In the case of equations, it is of primary importance to ensure that, at some point in either the introduction or the explanation of the equation, you define the symbols used. No matter how self-explanatory an expression like φ2= 3*ξ may seem, if your reader doesn’t know what φ and ξ signify, you may as well be typing nonsense.
Tables
In this context, “table” refers exclusively to data laid out in a grid format; if the data is rendered into a graph or other more visual format, that is a figure. In formatting tables, vertical lines are optional, and double horizontal lines may be used to signify the beginning and end of the table. Some horizontal lines may be removed if they are not necessary to understanding the table.
The table is labeled with the same format as a section or appendix heading, along with a title. Note that tables are enumerated with Roman numerals. Below the table, you may include explanatory notes as necessary; notes that apply to a specific part of the table should be marked in the same manner as a footnote, but notes that apply to the whole table are merely treated as captions.
See below for an example of what a table might look like in an IEEE paper. Note that this image (as well as the other ones on this page) have been zoomed in for clarity and detail.
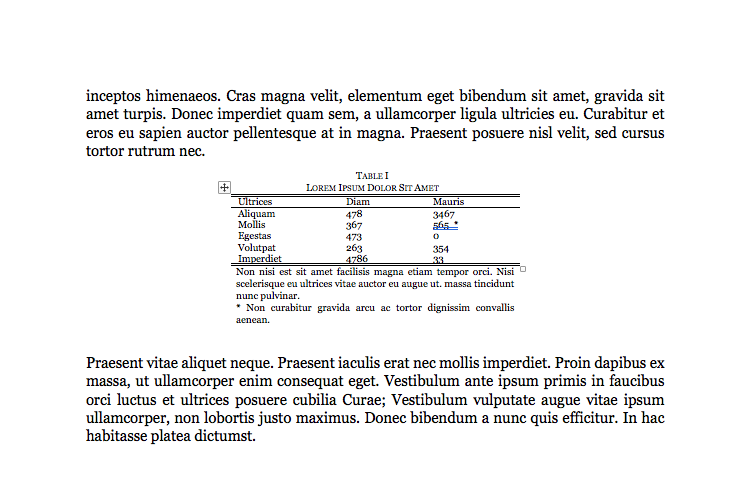
Example of a table in an IEEE paper. Note the small caps formatting for the table's title and the presence of a note underneath the table in a "caption" position.
Figures
“Figure” is a broad term that covers any image, graph, diagram, etc. that is neither a “table” nor an “equation”. Please note that these should always simply be referred to as “figures” – IEEE format does not recognize labels such as “graph 1”.
Unlike tables, the label for a figure goes below the figure. It is in sentence case, rather than small caps, and does not include line breaks. The format is as follows: “Fig.”, followed by the number, then a period and an em space, followed by the title for the figure. It is recommended that figures be titled in an informative manner that includes what/where/when information. For instance, an effective title might be something like “Fig. 3. Number of citation errors in undergraduate papers at Purdue University, 2005-2015.”
If parts of the figure are labeled specifically, this should be done with a lowercase letter within parentheses. The explanation of those labels should be included in the label for the overall figure. See the following example:
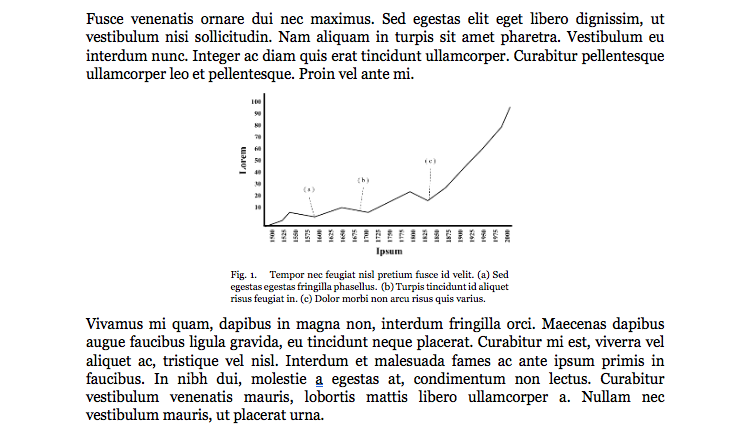
Example of a figure in an IEEE paper. Note that the caption formatting differs from the formatting for a table note.
Equations
It is acceptable to use the built-in functions of your word processor to create equations, but there are a few elements of the process that require your attention. First, note that while variables and numbers should be italicized, the following elements of equations should be set in roman type: function names, units, words, and abbreviations thereof.
Equations are centered on the page and labeled with Arabic numerals, right-aligned, in parentheses, and referred to only by those numbers in the text – e.g., you should always say “as seen in (3)” rather than “as seen in Equation (3)”. The only exception to this is if the equation number would begin a sentence, in which case you can say “Equation (3) shows…” in order to avoid the awkwardness of beginning a sentence with a numeral.
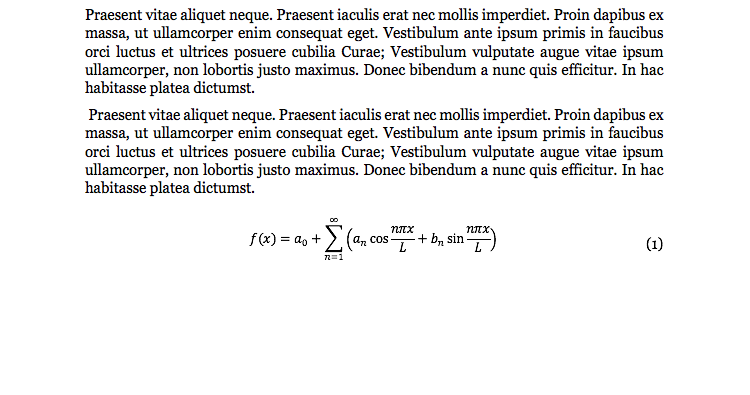
Example of an equation in an IEEE paper. Note that the equation has been written using Microsoft Word's built-in "insert equation" feature.